
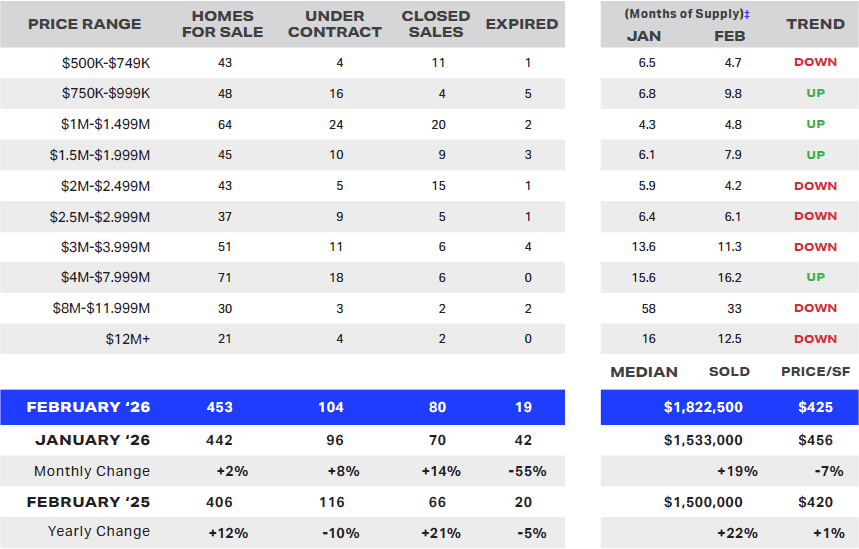
February’s data continues to show a market clearly segmented by price point, with the median guard-gated home price rising to just over $1.8 million.
The key inflection point remains at $3 million. Above that threshold, inventory expands into double-digit months of supply—shifting leverage toward buyers and creating increased competition among sellers. In this segment, pricing precision and presentation are no longer optional; they’re decisive.
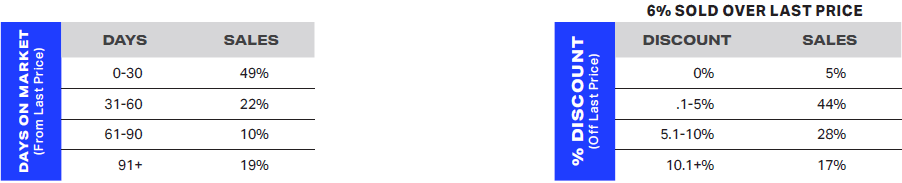
We’re also seeing a measurable shift in market velocity. Approximately 19% of February’s sales required more than 90 days from their last price adjustment—well above the historical norm of 5–10%. This is a clear indicator that buyers are taking their time and responding primarily to properties that are aligned with market expectations.
At the same time, the buyer profile remains strong. Cash transactions accounted for 60% of February’s sales, up from 56% in January. These are disciplined, well-capitalized buyers who are patient, selective, and highly attuned to value.
For sellers, understanding exactly where your property sits within these price segments is critical to both timing and outcome. For buyers, recognizing where leverage exists allows for more strategic offer positioning.
For a direct, data-driven assessment of your specific situation, call us at 702-605-7482 or visit robjensen.com.
Understanding the Data
Active Listings are homes that are currently on the market and available for sale. This is the pool of options that buyers can choose from at any given time.
Under Contract (also referred to as Pending or In Escrow) means a buyer and seller have agreed on a deal. From there, it usually takes 30–45 days to complete inspections, finalize financing, and close the sale.
Closed Sales represent homes that have completed the entire sales process. The buyer and seller have fulfilled all conditions, funds have been transferred, and the property has officially changed ownership.
Expired indicates a home was on the market, but the listing agreement expired and the home failed to sell.
Months of Supply is one of the most reliable indicators for gauging the balance between supply and demand in any housing market. It measures how long the current inventory would last at the existing sales pace—expressed in months, not the number of homes for sale. Around 6-7 months of supply is considered a balanced market. When supply falls below that level, it becomes a seller’s market where prices tend to rise; when it rises above, it shifts to a buyer’s market where prices may decline. The further Months of Supply moves from this midpoint, the stronger those price movements tend to be.
Market Trends – February 2026
Sold Properties – February 2026
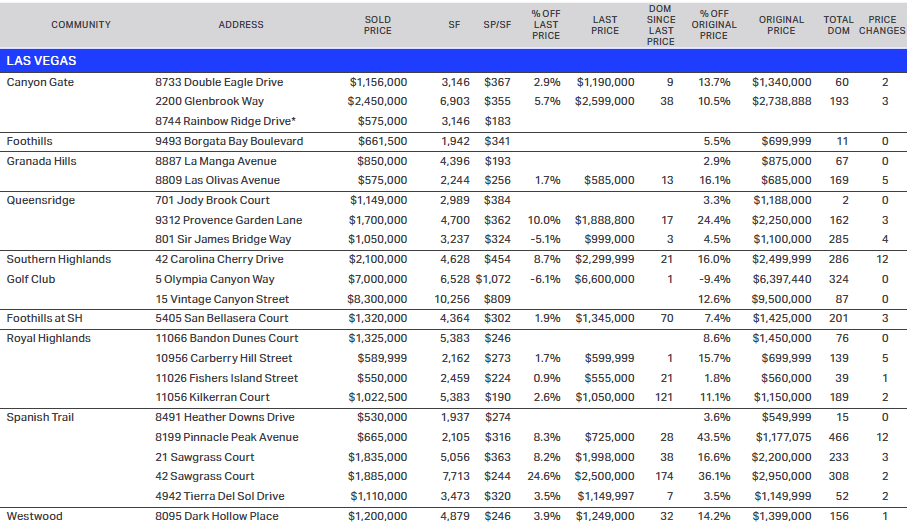
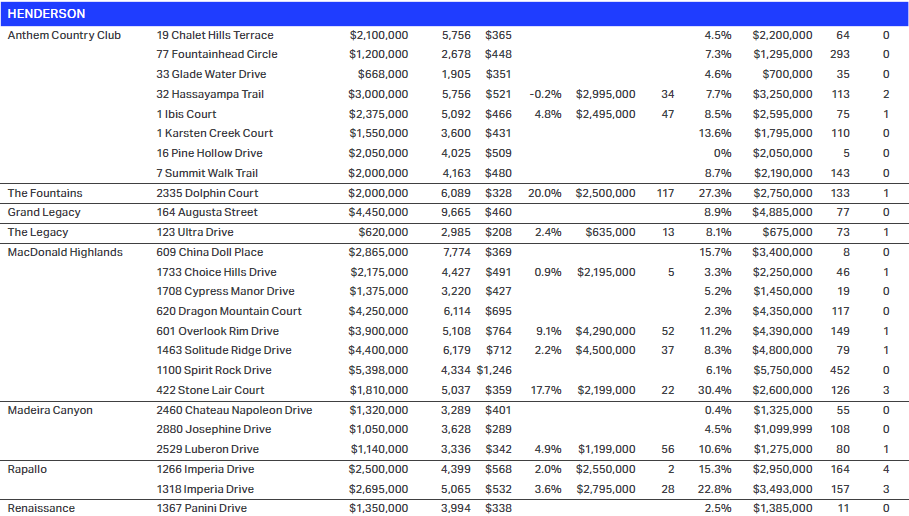
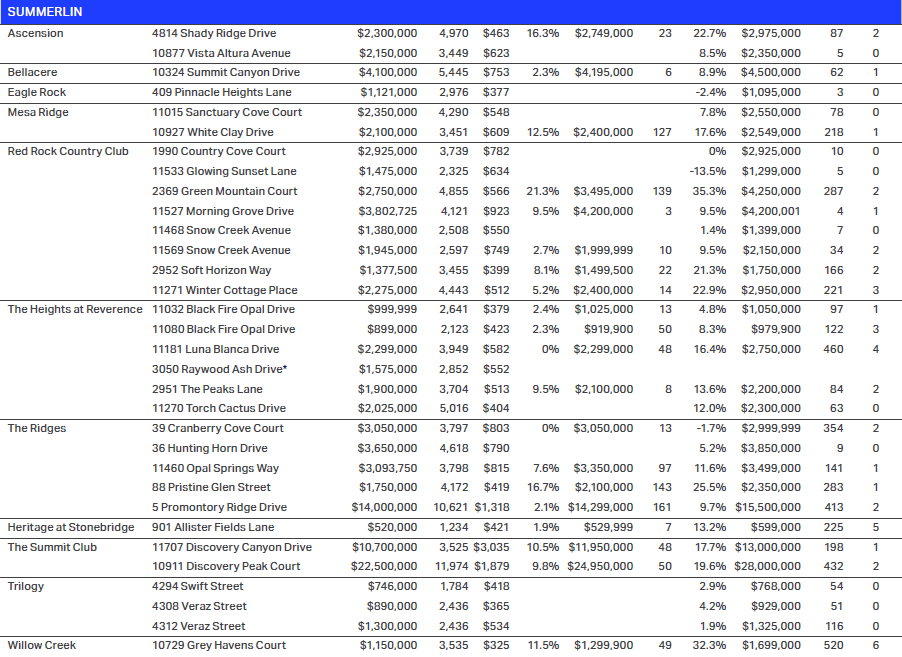
You can download a detailed spreadsheet of last month’s sales data—including final sold prices, original list prices, price reductions, previous sales dates, percent appreciations, and more—by clicking here.
Please reference the following info to help you understand the spreadsheet:
*Sold without being listed on the Multiple Listing Service (MLS).
†Missing data for the % Increase, Last Sold Price, and Last Sold Date because there was no prior sale as a completed property.
§Previous sale was a foreclosure transfer/trustee sale.
When you encounter a negative number for % OFF LAST PRICE and % OFF ORIGINAL PRICE, this means the sales price was higher.
REO – Real Estate Owned/Bank Foreclosure
DOM – Days on Market


