
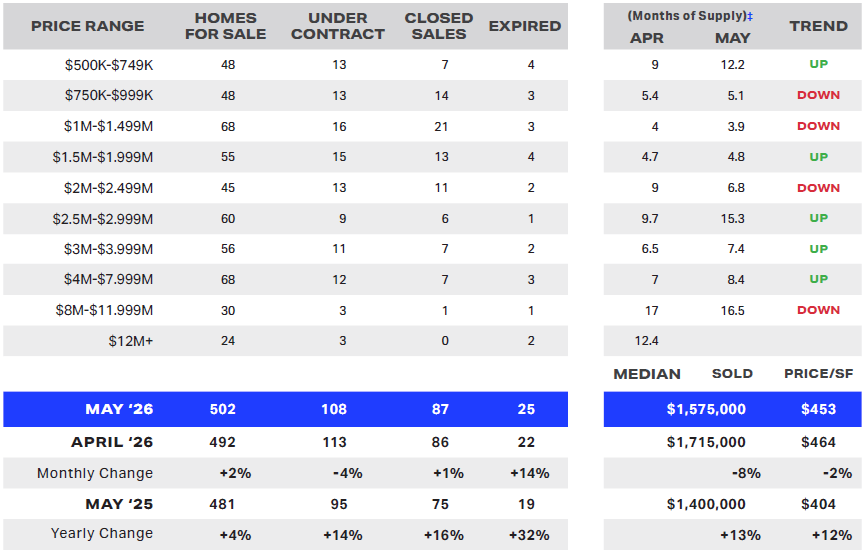
The Las Vegas guard-gated market remained active in May, even as pricing softened month over month. The median sold price fell to $1,575,000, down 8% from April, while the median price per square foot fell from $464 to $453. Still, both figures were higher than last year.
Supply continued to build, with 502 homes actively listed at the end of May—up 2% from April and 4% from last year. Pending sales dipped slightly month over month, with 108 homes under contract, but remained 14% higher than last May. Closed sales totaled 87, essentially flat from April and up 16% year over year.
Conditions continue to vary widely by price range. Homes from $750k to $2M remained in seller’s market territory, with less than 6 months of supply. The $2M to $2.5M and $3M to $4M ranges were closer to balanced, while the remaining price ranges favored buyers. Sellers in those segments should be aware that elevated inventory gives buyers more options. Please note: supply for homes priced at $12M+ is left blank this month because it is calculated using the average number of sales over the past two months, and there were no sales in April or May.
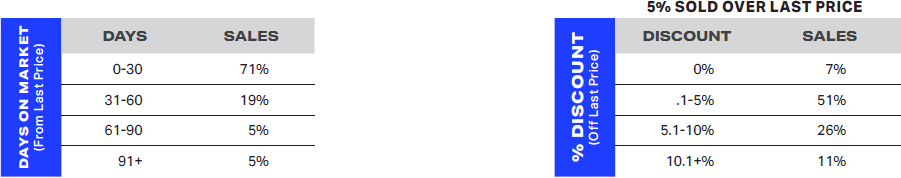
Once a home is priced correctly, it doesn’t take long to sell. In May, 71% of homes sold within 30 days of their last price, and 90% sold within 60 days. Only 5% took longer than 90 days.
Cash activity also remained strong, with 47% of guard-gated buyers paying cash in May, compared to 50% in April.
As we move toward summer, opportunities exist for buyers and sellers—but the right strategy depends heavily on price range, neighborhood, and your timeline.
Understanding the Data
Active Listings are homes that are currently on the market and available for sale. This is the pool of options that buyers can choose from at any given time.
Under Contract (also referred to as Pending or In Escrow) means a buyer and seller have agreed on a deal. From there, it usually takes 30–45 days to complete inspections, finalize financing, and close the sale.
Closed Sales represent homes that have completed the entire sales process. The buyer and seller have fulfilled all conditions, funds have been transferred, and the property has officially changed ownership.
Expired indicates a home was on the market, but the listing agreement expired and the home failed to sell.
Months of Supply is one of the most reliable indicators for gauging the balance between supply and demand in any housing market. It measures how long the current inventory would last at the existing sales pace—expressed in months, not the number of homes for sale. Around 6-7 months of supply is considered a balanced market. When supply falls below that level, it becomes a seller’s market where prices tend to rise; when it rises above, it shifts to a buyer’s market where prices may decline. The further Months of Supply moves from this midpoint, the stronger those price movements tend to be.
Market Trends – May 2026
Sold Properties – May 2026
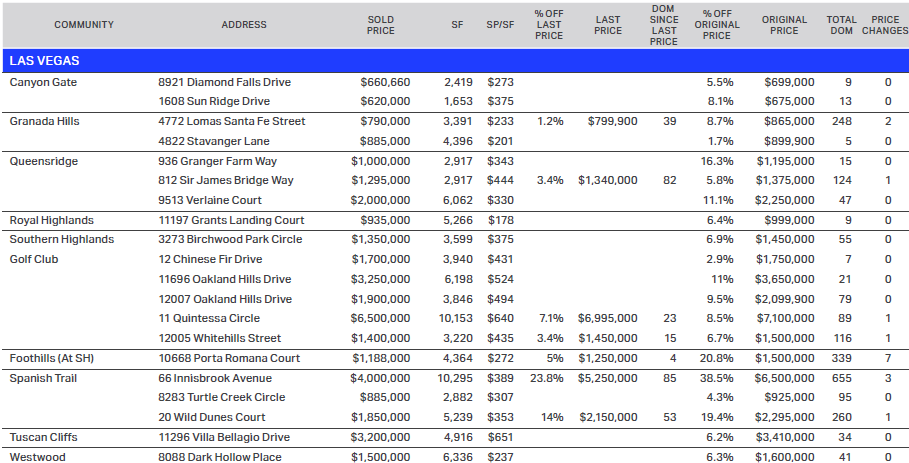
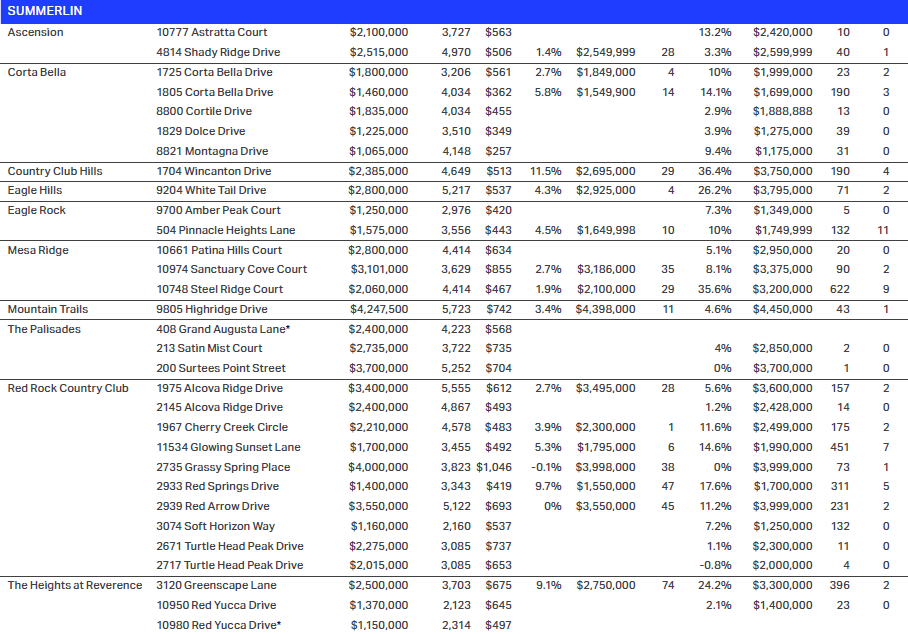
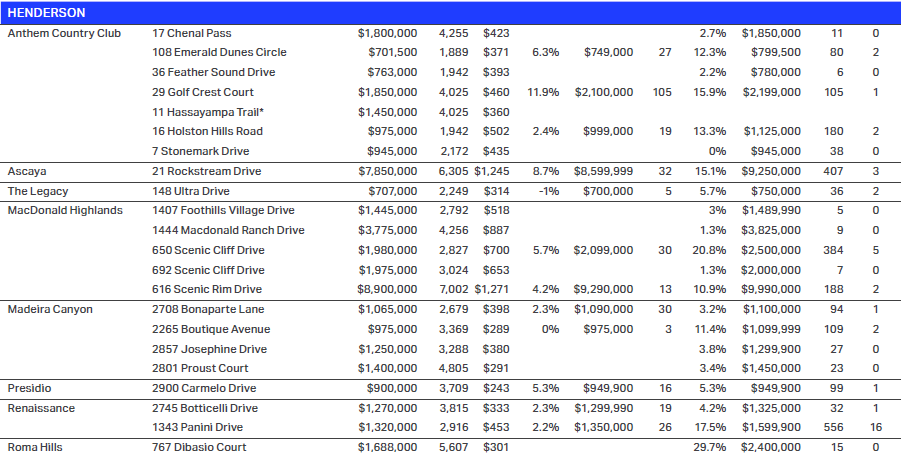
You can download a detailed spreadsheet of last month’s sales data—including final sold prices, original list prices, price reductions, previous sales dates, percent appreciations, and more—by clicking here.
Please reference the following info to help you understand the spreadsheet:
*Sold without being listed on the Multiple Listing Service (MLS).
†Missing data for the % Increase, Last Sold Price, and Last Sold Date because there was no prior sale as a completed property.
§Previous sale was a foreclosure transfer/trustee sale.
When you encounter a negative number for % OFF LAST PRICE and % OFF ORIGINAL PRICE, this means the sales price was higher.
REO – Real Estate Owned/Bank Foreclosure
DOM – Days on Market


