
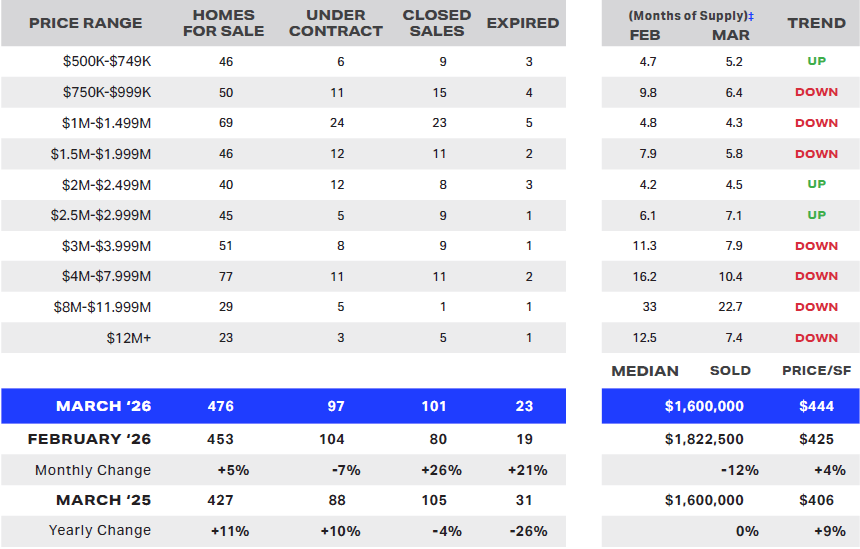
The data for March points to a market gaining momentum as we enter the spring selling season. Closed sales have increased, and while inventory has grown modestly, the pace of demand is keeping supply levels in check. Year-over-year figures, however, suggest some softening, with inventory up 11% and closed sales down 4%.
7 of the 10 price categories we track saw improvements, with months of supply trending downward. Most segments are now balanced or leaning toward sellers. The primary exception is the $4 million to $12 million range, where higher inventory levels are creating increased competition for sellers and greater negotiating power for buyers.
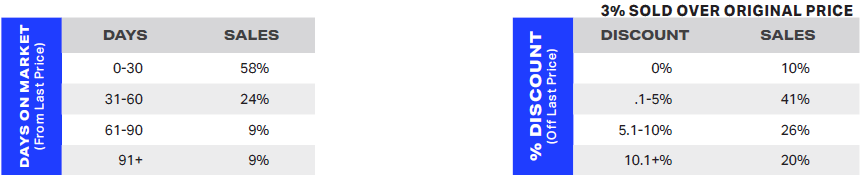
We’re also seeing improved efficiency in the market. In March, 91% of homes took 90 days or less to sell from their last price—much closer to historical norms and a significant improvement from 81% last month. This reinforces the importance of pricing correctly from the start, as well-positioned homes are still moving quickly.
Buyer behavior is shifting slightly as well. Cash purchases declined to 45% of sales, down from 60% in February, suggesting a modest return of financed buyers as confidence improves.
If you’re considering selling, understanding how your home fits within today’s price segments—and pricing it accordingly—will be key to maximizing your outcome. And if you’re buying, opportunities continue to expand in the upper price ranges where supply remains elevated. For a clear strategy based on your goals, call us at 702-605-7482 or visit robjensen.com.
Understanding the Data
Active Listings are homes that are currently on the market and available for sale. This is the pool of options that buyers can choose from at any given time.
Under Contract (also referred to as Pending or In Escrow) means a buyer and seller have agreed on a deal. From there, it usually takes 30–45 days to complete inspections, finalize financing, and close the sale.
Closed Sales represent homes that have completed the entire sales process. The buyer and seller have fulfilled all conditions, funds have been transferred, and the property has officially changed ownership.
Expired indicates a home was on the market, but the listing agreement expired and the home failed to sell.
Months of Supply is one of the most reliable indicators for gauging the balance between supply and demand in any housing market. It measures how long the current inventory would last at the existing sales pace—expressed in months, not the number of homes for sale. Around 6-7 months of supply is considered a balanced market. When supply falls below that level, it becomes a seller’s market where prices tend to rise; when it rises above, it shifts to a buyer’s market where prices may decline. The further Months of Supply moves from this midpoint, the stronger those price movements tend to be.
Market Trends – March 2026
Sold Properties – March 2026
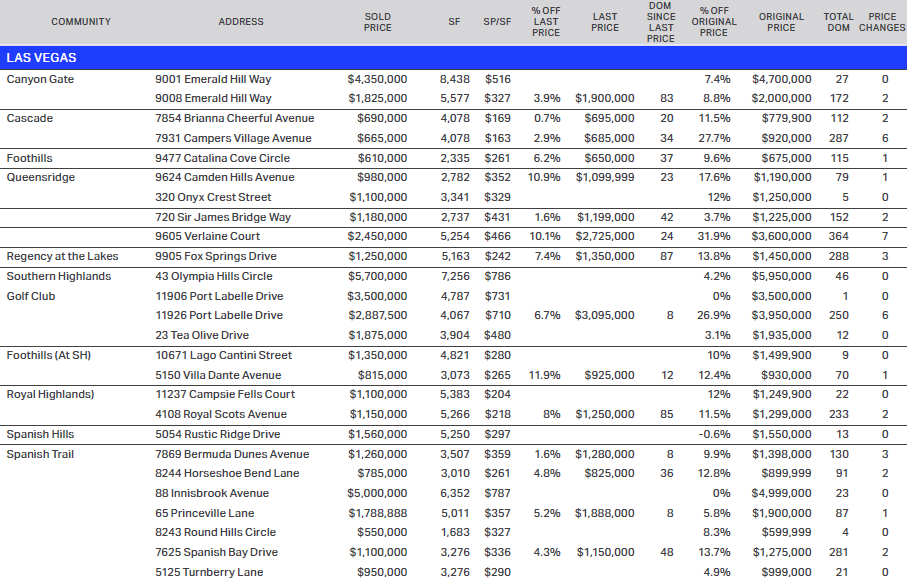
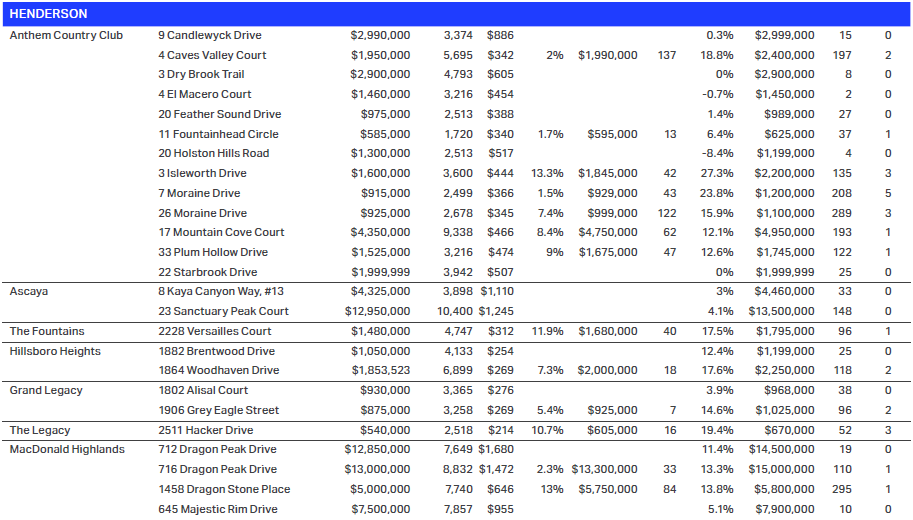
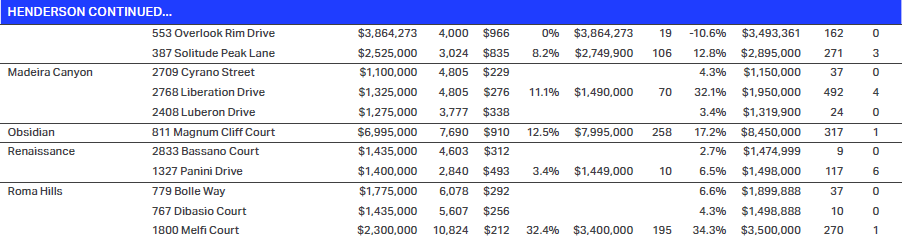
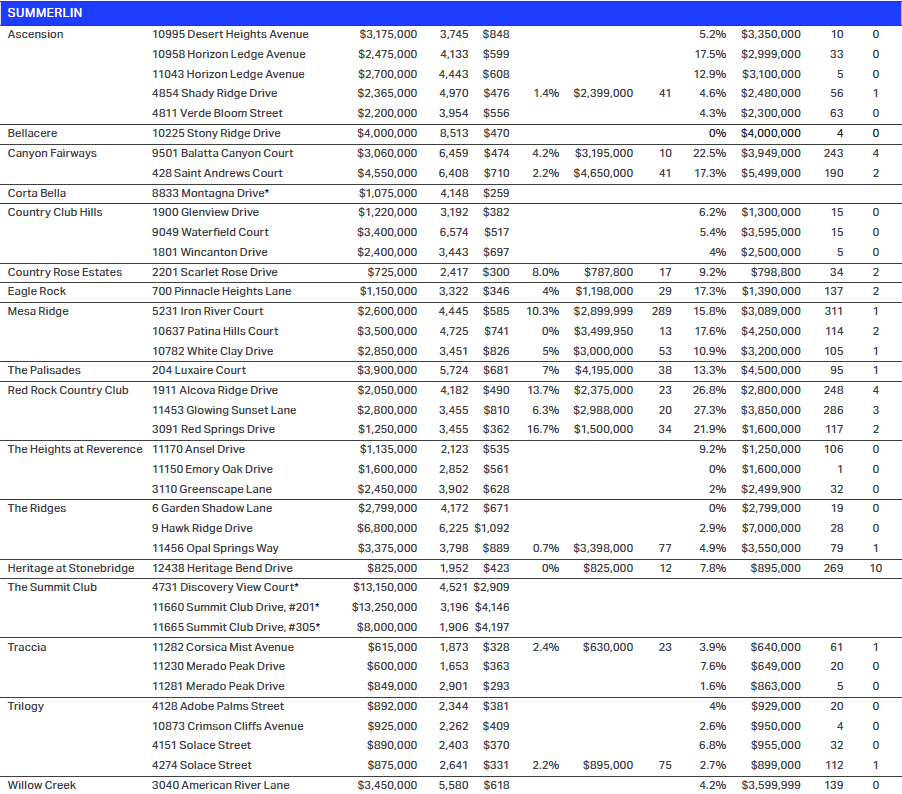
You can download a detailed spreadsheet of last month’s sales data—including final sold prices, original list prices, price reductions, previous sales dates, percent appreciations, and more—by clicking here.
Please reference the following info to help you understand the spreadsheet:
*Sold without being listed on the Multiple Listing Service (MLS).
†Missing data for the % Increase, Last Sold Price, and Last Sold Date because there was no prior sale as a completed property.
§Previous sale was a foreclosure transfer/trustee sale.
When you encounter a negative number for % OFF LAST PRICE and % OFF ORIGINAL PRICE, this means the sales price was higher.
REO – Real Estate Owned/Bank Foreclosure
DOM – Days on Market


